
I got stuck on what should be a trivial question: how much smarter is the best AI model today than it was in January 2025?
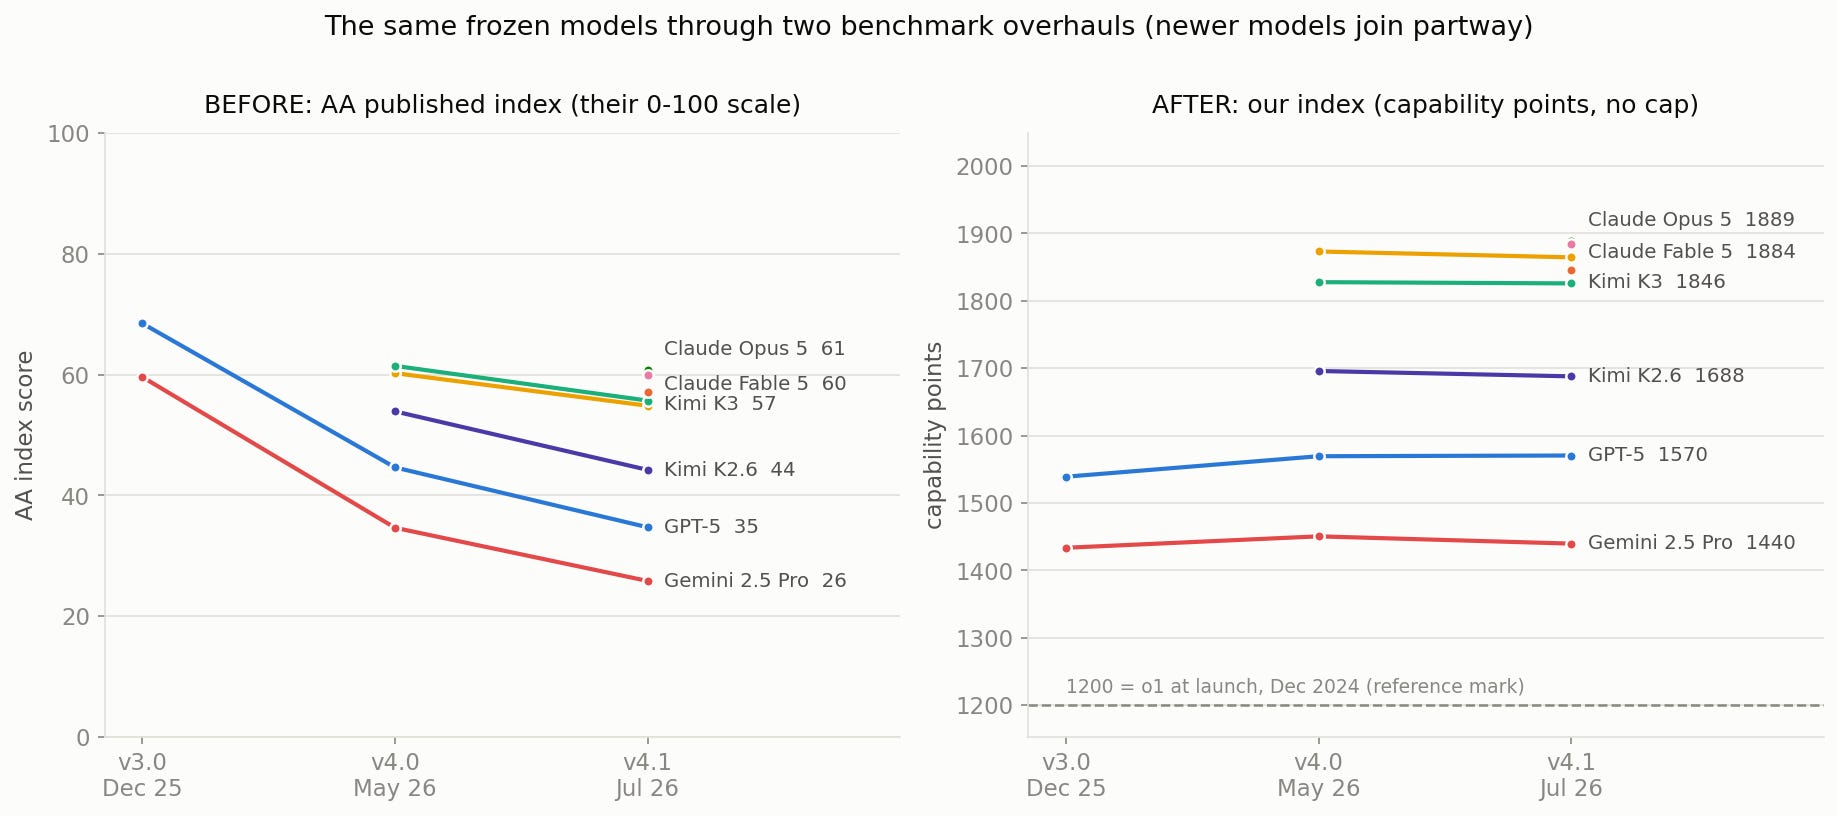
You’d think a leaderboard could tell you. My favorite is Artificial Analysis. It’s genuinely one of the best eval shops around since they run everything themselves and publish per-benchmark scores, which most people don’t. Their top score in August 2025 was 69. Today it’s 61. Over a period in which the frontier moved from GPT-5 to GPT-5.6. The number seems to be moving in the wrong direction.
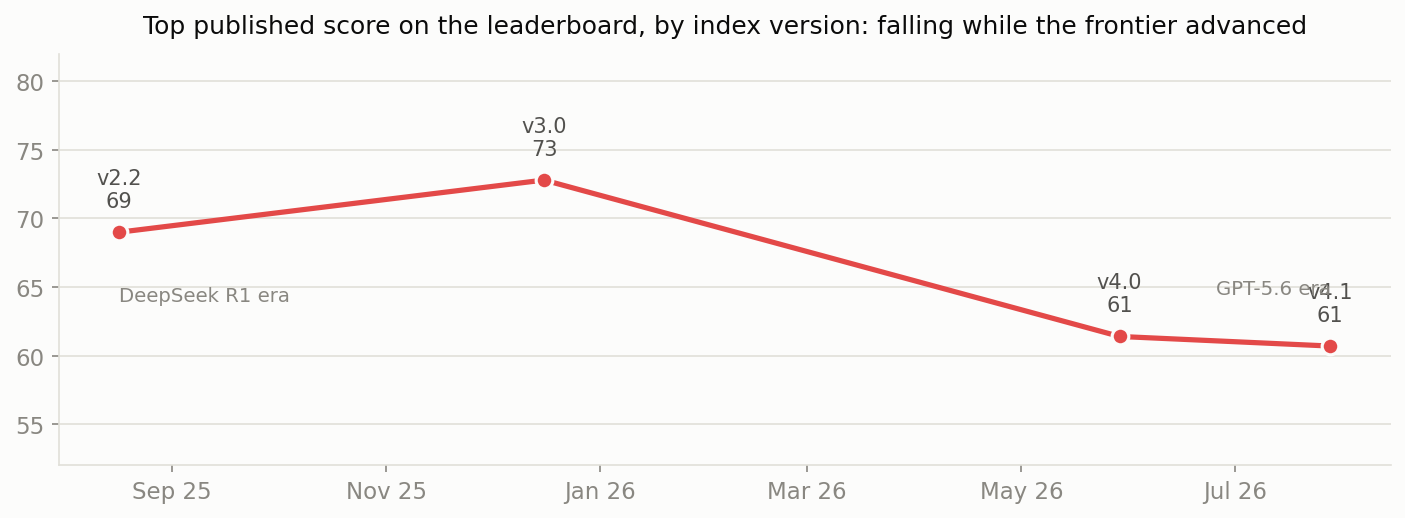
This is what I call a “necessary evil”. Since models keep maxing out the old benchmarks they have to add harder benchmarks multiple times in an year. AA’s index is based on a weighted average of scores, hence adding a new difficult benchmark brings down the total score of the model (say, a model that was scoring 69 in one version would score 35 in the next), although no weights were changed.
Evals for models are like tests for humans and this exact problem was solved decades ago for humans. The SAT is a popular entrance exam that replaces its questions every single year, and yet a score from 2015 is comparable to a score from 2025. Nobody’s SAT score drops because a harder question booklet came out. I borrowed the same machinery that makes this possible for human testing and applied it to AI models.
So I built an AI index that works the way the SAT does, where scores stay comparable no matter how many times the questions change. This post is the story of building it, and my insights I discovered.
The result first
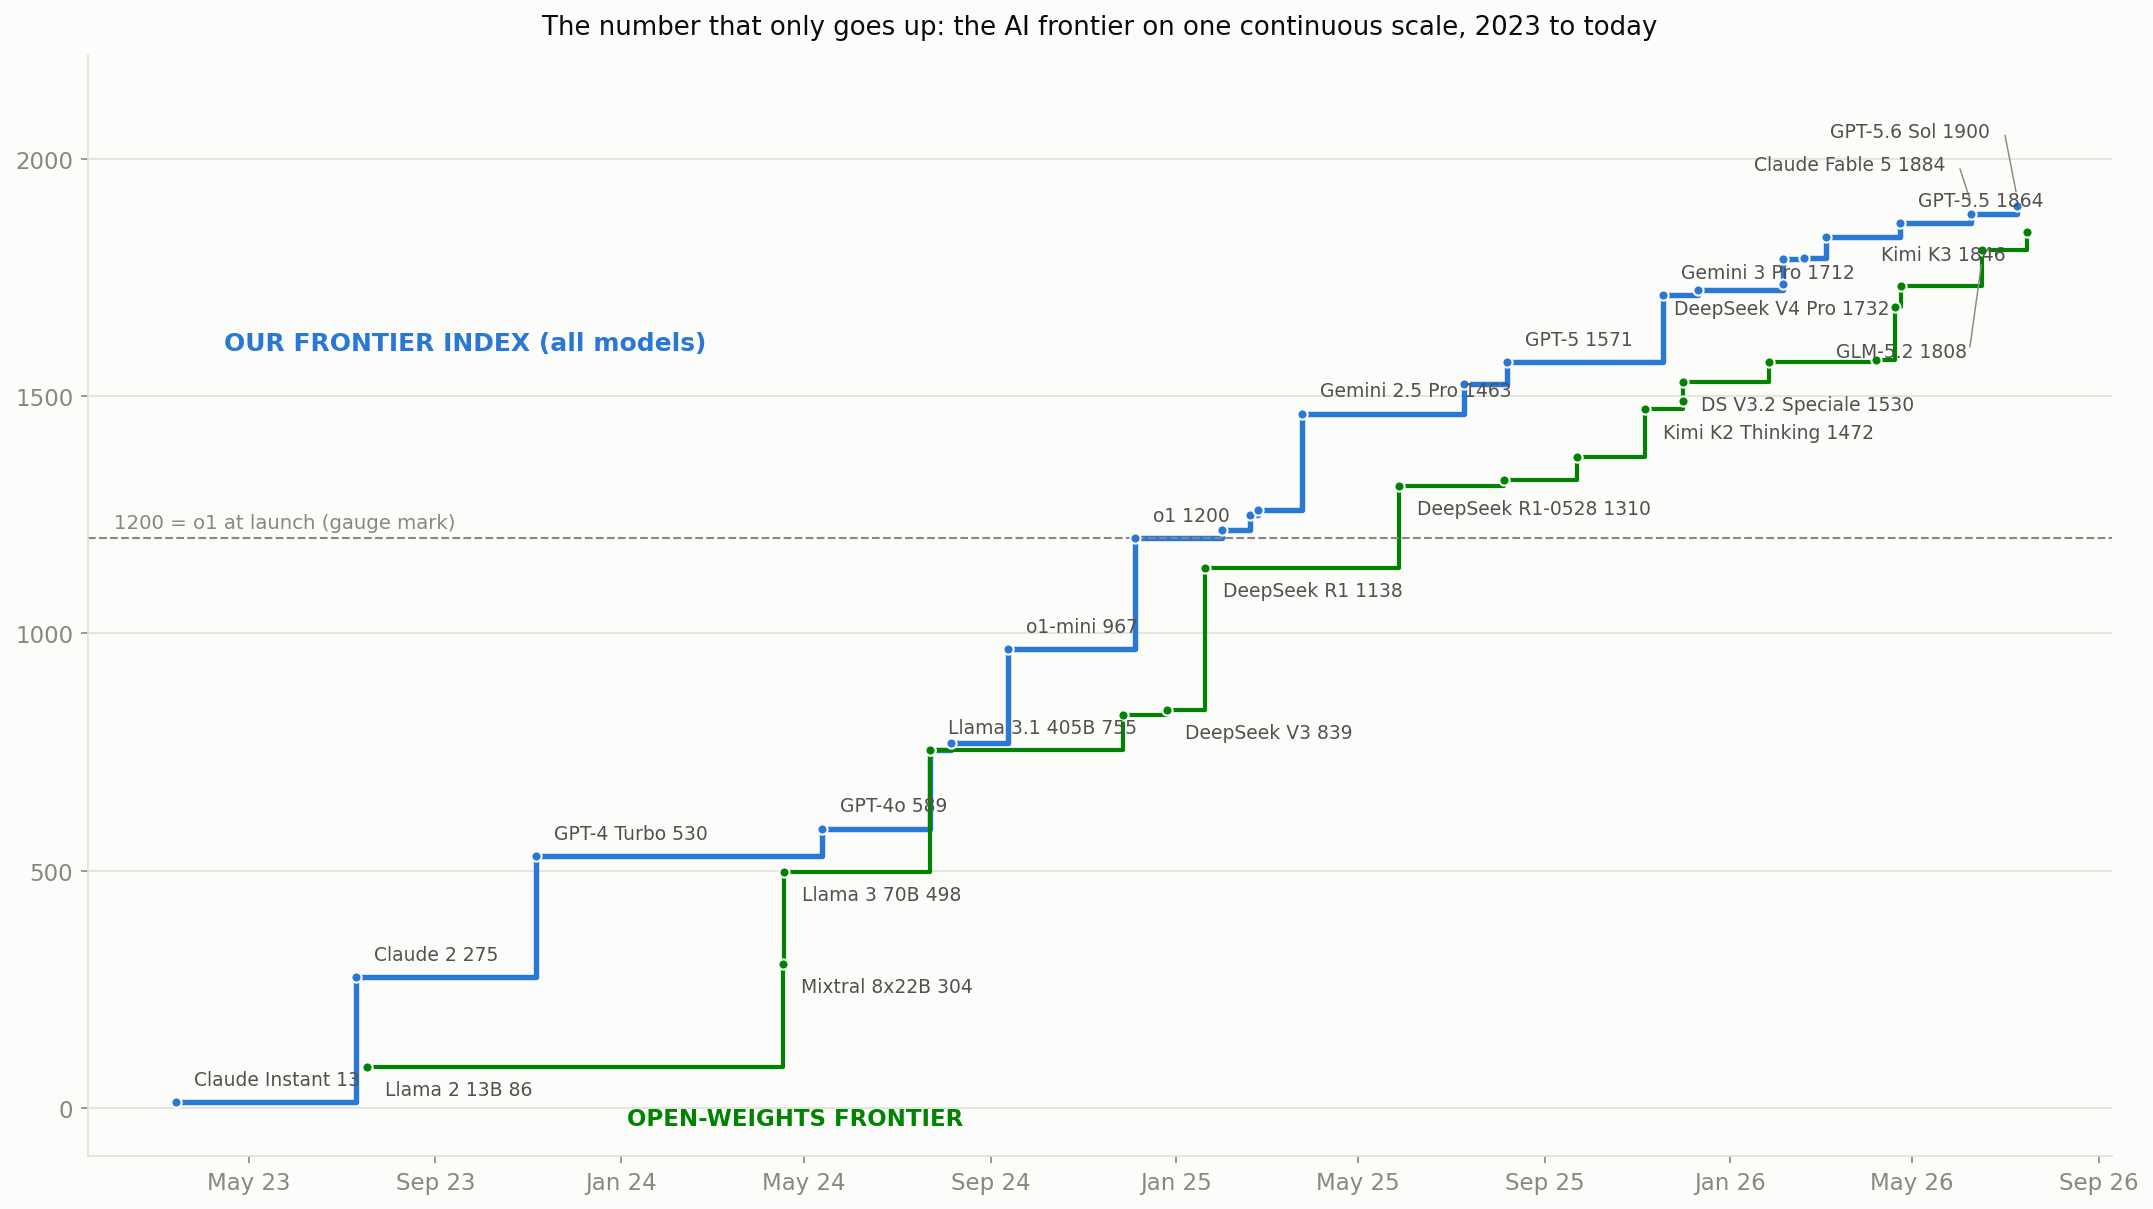
I plotted the best available model at each date(starting early 2023), on one continuous scale with no cap. The frontier has moved nearly 1,900 points in three and a half years. That’s the answer I wanted. There’s no ceiling to approach, so nothing gets compressed and nothing ever resets.
The green line is the same envelope computed only over open-weights models. Two things you can seen so cleanly now:
The open frontier reached GPT-5’s 1571 in January 2026, about five months behind the closed frontier and the gap has tightened since.
Today Kimi K3 at 1846 versus GPT-5.6 Sol at 1900, the closest the two lines have been all period.
How it’s built
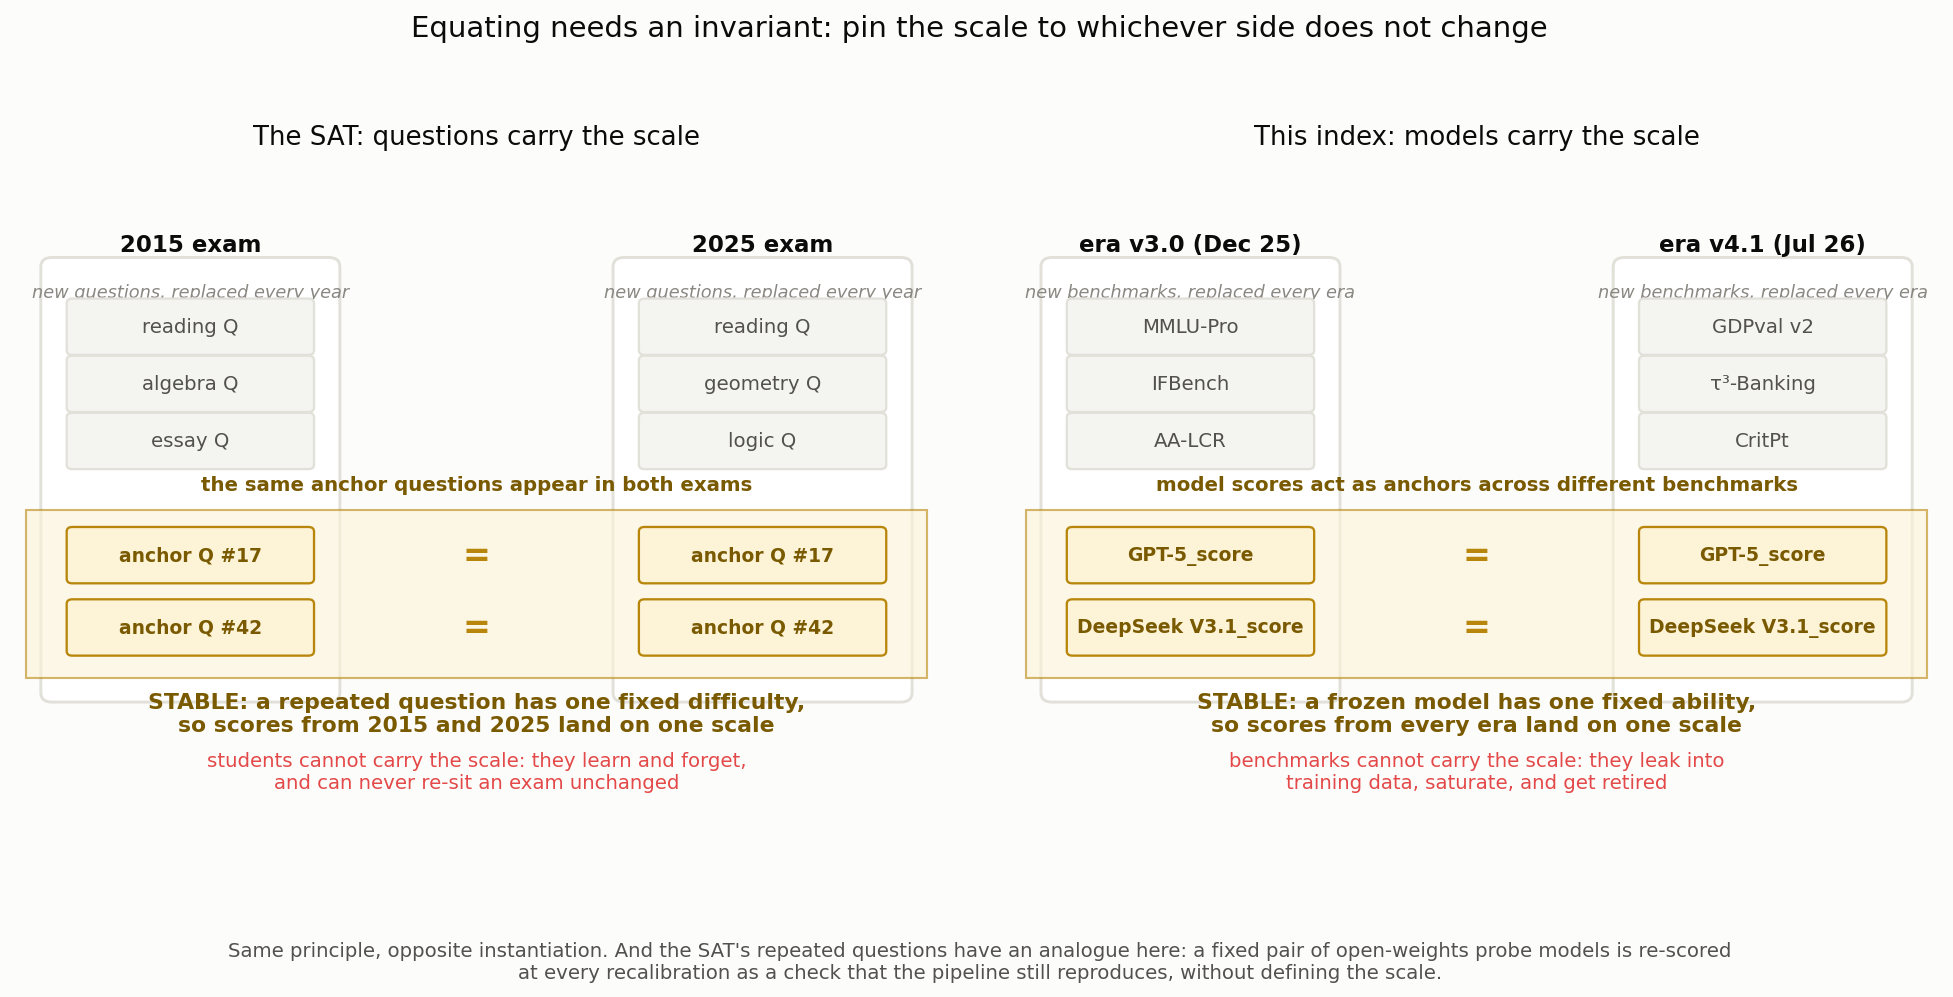
Underneath is Item Response Theory, the SAT machinery from earlier. You fit a difficulty rating to every benchmark and estimate model ability through those ratings, so when a new hard benchmark shows up and everyone scores 15%, the difficulty gets booked against the benchmark instead of the models.
Let’s understand how IRT works for SAT. Every question carries two fitted parameters: a difficulty and a discrimination (which discriminates strong vs weak students). A small set of anchor questions with already-known parameters repeats across exams. A new student’s ability is estimated from their pattern of right and wrong answers on questions whose parameters(difficulty and discrimination) are known and a new question’s parameters(difficulty and discrimination). Each side calibrates the other, and the repeated anchors pin the loop to one scale, which is why scores are comparable over years.
The SAT methodology does not directly apply to AI models since benchmarks leak into training and models are getting exponentially better. In my approach, the anchoring flips to the model side, because models are the side that never changes. Model scores never change over time, and new models scores keep getting calibrated with that in mind and placed higher.
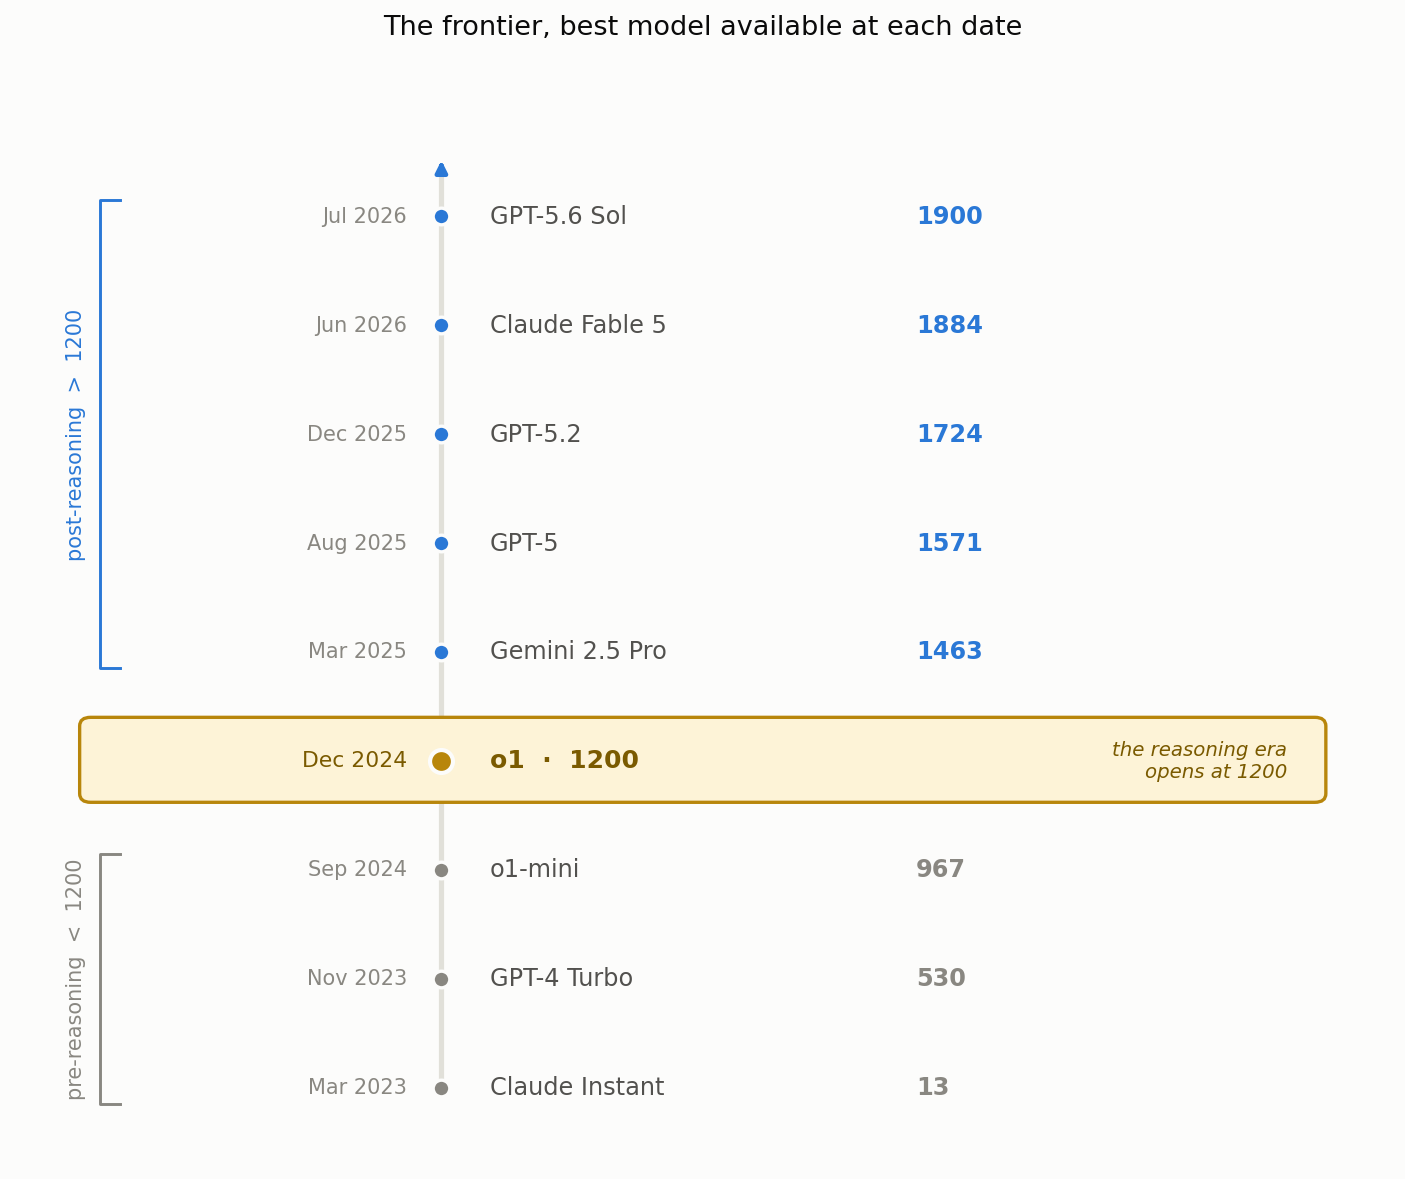
Anchoring on models instead of on a benchmark also makes these numbers human relatable. Nobody asks what the units of an Chess rating are: 1200 is a solid club player and a grandmaster nears 2500, because the scale is pinned to players that can be pictured. This index reads the same way. My point of origin sits at 1200 which is o1 at its December 2024 launch, everything below 1200 is the pre-reasoning frontier (GPT-4 Turbo at 530), and today’s frontier is at 1900, so any new score lands somewhere on a map of models you already know. Please note these are not elo ratings - but they solve a common problem of human understanding of scores.
The replay
I replayed four Artificial Analysis index eras using leaderboard snapshots from all the way back to 2025. Artificial Analysis doesn’t show the old leaderboards anymore, but I was able to get the old preserved versions from the Internet Archive!
By construction, published history stays frozen: adding new benchmarks changed old scores by exactly zero. When we deliberately re-measured frozen models under a new benchmark suite the scores stay within 1% error margin(inference noise). For comparison, the same version bump moved AA’s published numbers by 30% points on average, and by up to 50% for the worst-hit model.
Newer famous models like Opus 4.8, GPT-5.5, Kimi K3, and Claude Fable 5 join partway through, which the method handles well by simply scoring on the benchmarks that existed at the same time as them.
Projections on pace of the frontier
Because this index has no cap, it gives us room to project forward. We can use the distance the frontier has climbed so far to ask : if progress continues at a similar rate, how far could the frontier move, and how long might it take to reach a given score?
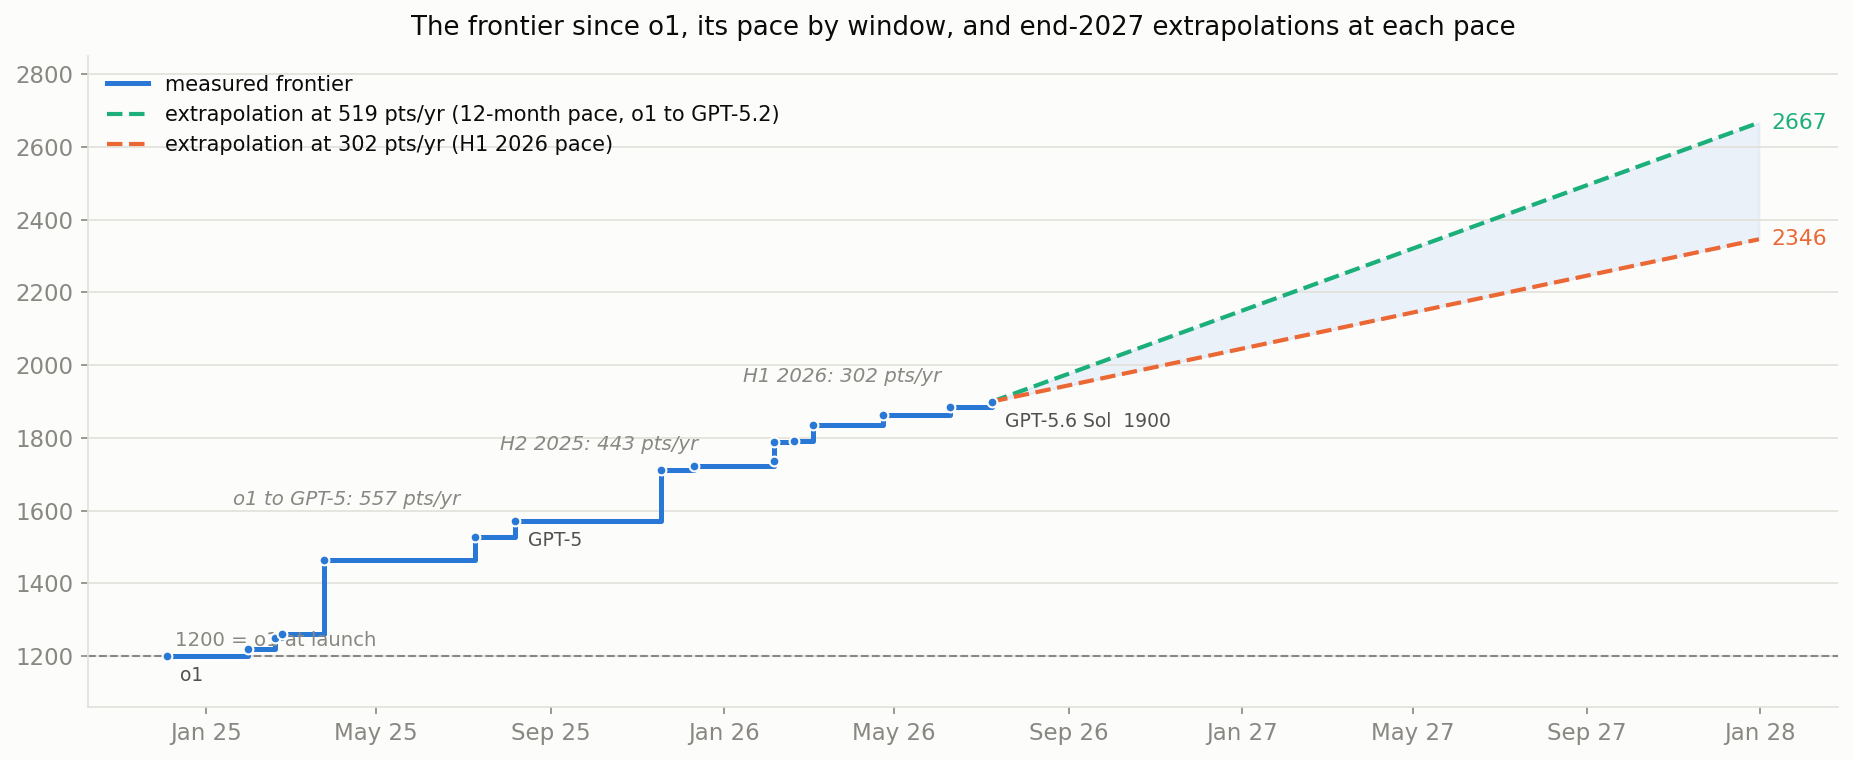
Starting from today’s score of 1900, those rates produce different scenarios for the end of 2027. At 519 points per year, the frontier would reach roughly 2667. At 302 points per year, it would reach about 2346.
These are not predictions. They are useful, testable projections that the index can update with every major model release.
Benchmarks die on schedule
A side mission that I encountered while solving the original question was : can you can forecast when each benchmark stops working? Here is what I found in AA current eval suite - GPQA is already dead. Terminal-Bench 2.1 has until about October. AA-LCR and CritPt make it to early 2027. τ³-Banking and SciCode are fine past 2028.
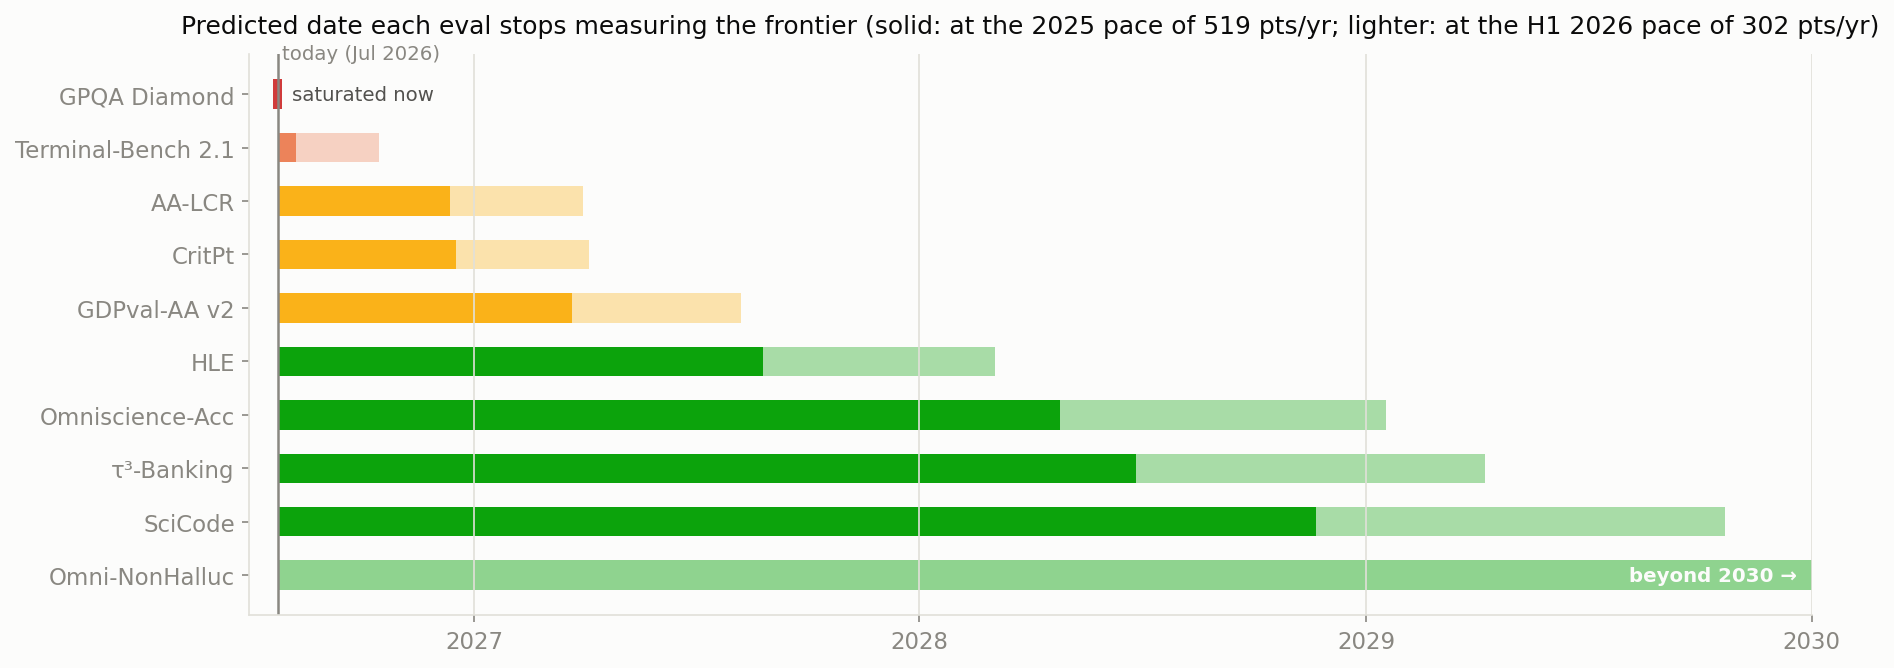
A benchmark “stops working” when it becomes too easy. Once top models are expected to score above 90%, their results bunch together and the test can no longer tell them apart. That is saturation.
Because benchmarks and models share the same scale, we can estimate when each test will reach that point using recent rates of 519 and 302 points per year.
The goal is simple: keep at least three tests harder than the frontier, prevent any one test from carrying more than 40% of the measurement, and replace tests expected to saturate within six months. Right now, only two tests are harder than the frontier.
Credits and Caveats
All the data here comes from Artificial Analysis, whose per-benchmark transparency is the only reason this replay was possible, plus the Wayback Machine. Their version resets are deliberate choices, not mistakes; this is an argument about what else the same data can support.
I’m not the first to point this at AI models. Epoch’s Capabilities Index does IRT across 50+ benchmarks (their recent paper with DeepMind, “A Rosetta Stone for AI Benchmarks”, is the closest thing to this post in the literature), and METR measures progress in human task-minutes. Both exist because raw benchmark scores can’t be compared over time.
If this thing hits off, I will share a FAQ doc on all design decisions I took while building this and open source the code :)